How to Measure Product Market Fit: Proven Strategies
Learn how to measure product market fit effectively with our expert guide. Discover proven strategies to boost your product’s success. Read more!

Understanding What Product Market Fit Really Means
Let's be real, "product market fit" can sound like something dreamt up in a Silicon Valley boardroom. But it's a lot simpler than the jargon suggests. At its core, it's about building something people actually want. That sweet spot where your product clicks with your audience and growth takes off. I’ve spoken with lots of founders, and the ones who nail product market fit describe it as a real turning point – like a huge weight off their shoulders.
 This image shows the core idea behind product market fit: where what you create, what people want, and how you reach them intersect. That’s where the magic happens, turning a good idea into a successful business.
But textbook definitions often miss the mark. They talk about meeting market needs, but how does that actually play out in the real world? One helpful way to look at it is through levels of maturity, from Nascent (Level 1) all the way to Extreme (Level 4). Giants like Airbnb and Uber didn’t become overnight sensations. They climbed these levels, constantly tweaking things based on what their customers told them. Want to dive deeper? Check out this helpful resource on the levels of product market fit: Discover more insights. And if you’re a B2B startup, getting product market fit right is essential. This guide can help you navigate that tricky terrain: How to Achieve Product Market Fit.
This journey often involves busting some myths. For example, many founders mistake early excitement for genuine product market fit. They see some initial buzz and think they’ve cracked the code. But real, lasting growth isn’t built on hype. It’s built on deep, consistent engagement. Thinking about a micro-SaaS? This might be helpful: Read also: How to Build a Micro-SaaS. Truly grasping product market fit means knowing the difference between a product people like and one they absolutely depend on. It's not about "good enough." It’s about building something truly indispensable.
The Sean Ellis Test and Beyond: Metrics That Actually Matter
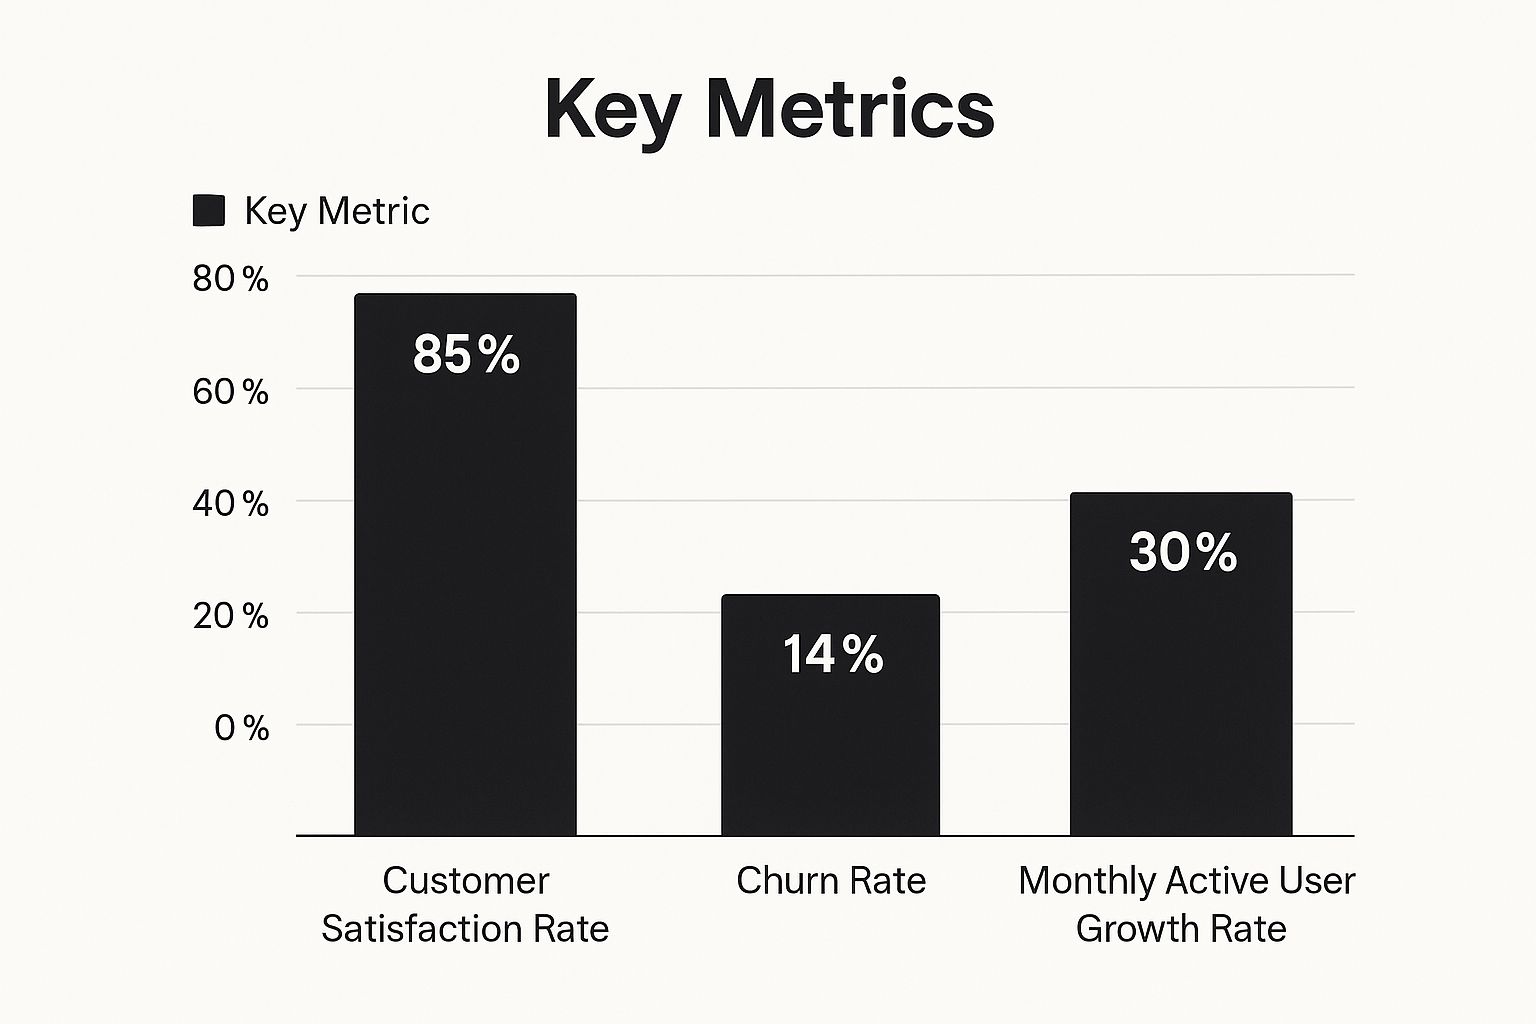
The infographic above gives you a visual snapshot of how customer satisfaction, churn rate, and monthly active user growth all play together. See how a high customer satisfaction score (85%) goes hand-in-hand with low churn (5%) and healthy monthly active user growth (20%)? That’s a strong signal of positive product-market fit. These numbers aren't just random; they're all connected.
The 40% Rule: A Starting Point, Not The Finish Line
You've probably heard of the Sean Ellis Test and its 40% rule. The idea is that if 40% of your surveyed customers say they'd be "very disappointed" without your product, you're in the product-market fit sweet spot. It's a helpful benchmark, sure, but in my experience, it's not the be-all and end-all. It’s more like a compass pointing you in the right direction. True product-market fit comes from looking at a range of metrics, making sure your product truly resonates with the market. The 40% rule is a good starting point, suggesting that if 40% of surveyed customers would be 'very disappointed' without your product, you're on the right track. Want to learn more? Discover more insights.
Beyond The Survey: Supporting Metrics That Complete The Story
While the Ellis test is valuable, it's just one piece of the puzzle. Think of it like checking your car's oil – it’s important, but it doesn't tell you everything about your car’s health. Metrics like bounce rate and time on site can tell you a lot about how users interact with your product. A high bounce rate might mean there's a mismatch between what users expect and what your product delivers. On the flip side, high time on site usually means users are engaged and finding value.
Customer Lifetime Value (CLV) is another powerful metric. A high CLV means customers are sticking around and getting long-term value from your product, which is a great sign for your business. Understanding what makes a business efficient is crucial for achieving product-market fit. This resource on improving workflow efficiency can offer some valuable insights. Giants like Google and Amazon constantly monitor these supporting metrics. They know that a complete picture of user behavior, not just a single survey, is crucial for achieving and sustaining product-market fit.
Avoiding Common Pitfalls: Sample Size And Survey Design
Even the best metrics can be misleading if you're not careful. Surveying just 20 people won't give you a reliable view of your target market. Aim for a larger sample size that truly represents your user base. How you phrase your survey questions matters too. Leading questions can skew your results and give you a false sense of product-market fit. Keep your questions neutral and open-ended to get honest feedback. Understanding these nuances can help you accurately assess your product’s position in the market.
To help you navigate these metrics, here’s a handy comparison table:
Essential Product Market Fit Metrics Comparison
A comprehensive comparison of key metrics used to measure product-market fit, including implementation difficulty, reliability, and best use cases.
| Metric | Implementation Difficulty | Reliability Score | Best For | Warning Signs |
|---|---|---|---|---|
| Sean Ellis Test (40% Rule) | Easy | Medium | Early-stage validation | Small sample size, biased questions |
| Customer Satisfaction (CSAT) | Easy | High | Ongoing monitoring | Response bias, lack of context |
| Churn Rate | Medium | High | Measuring customer retention | Different churn definitions |
| Monthly Active Users (MAU) | Easy | High | Tracking growth | Doesn't reflect engagement quality |
| Bounce Rate | Easy | Medium | Identifying usability issues | Can be affected by various factors |
| Time on Site | Easy | Medium | Measuring engagement | Doesn't always correlate with conversions |
| Customer Lifetime Value (CLV) | Hard | High | Long-term business viability | Requires accurate revenue and cost data |
This table summarizes the key metrics we’ve discussed, highlighting their strengths and weaknesses. Remember, using a combination of these metrics gives you the most comprehensive understanding of your product-market fit.
Reading Your Retention Story Through Cohort Analysis

This screenshot shows how cohort analysis paints a picture of user retention over time. Each row represents a group of users who joined during a specific week. The columns track their activity in the following weeks. See how the percentages decline across each row? That’s a typical retention curve.
It’s interesting to note how each cohort tends to follow a similar downward trend. This highlights the importance of consistently working to keep users engaged. While some initial drop-off is expected, holding onto a core group of active users over the long haul is key for sustainable growth.
So, where do retention cohorts fit into measuring product-market fit? They’re like individual stories within your product's overall user narrative. By following groups of users who signed up around the same time, you get a sense of whether they’re sticking around or bouncing quickly. This isn’t about superficial metrics like downloads. It’s about understanding how people actually use your product.
For example, a streaming service might track cohorts to see which shows keep viewers coming back week after week. A SaaS company could use cohorts to pinpoint the features driving long-term engagement. High retention rates within these cohorts are a strong indicator of product-market fit, showing that users consistently find value. Discover more insights.
This long-term perspective lets you spot problems early on. Imagine an e-commerce platform noticing a sharp decline in a specific cohort after their first purchase. That’s a red flag pointing to a potential issue with the post-purchase experience. Maybe shipping is too slow, or the return process is overly complicated. Cohort analysis helps pinpoint these friction points so you can address them proactively. It gives you a direct line to understanding what makes your users happy.
Interpreting the Curves: What Your Cohorts Are Telling You
Learning to interpret these retention curves is like deciphering a secret code. A flat line is a great sign—it means your product is consistently delivering value. A steep drop-off usually suggests a problem somewhere in the user journey.
A gradual decline is pretty normal, but you should still look for opportunities to slow it down and maintain user engagement. For instance, let's say you’re building a language-learning app. If your cohorts show a sharp decline after the first week, it could mean the initial learning curve is too steep.
Maybe your onboarding needs to be more engaging, or your initial lessons are too difficult. By understanding these patterns, you can make informed decisions about how to improve your product and boost retention. It’s about going beyond surface-level metrics and really understanding the why behind user behavior. This is crucial for building a product that truly connects with your target market.
Let's look at some industry benchmarks to give you a better idea of what good retention looks like. The following table provides a general overview, but remember, these are just averages. Your specific targets will depend on your industry, business model, and target audience.
Retention Cohort Benchmarks by Industry
| Industry | Day 1 Retention | Week 1 Retention | Month 1 Retention | Strong PMF Indicator |
|---|---|---|---|---|
| SaaS | 35% | 20% | 15% | >20% Month 1 Retention |
| Mobile Gaming | 40% | 15% | 5% | >10% Month 1 Retention |
| E-commerce | 30% | 10% | 5% | >8% Month 1 Retention |
| Media/Content | 50% | 25% | 15% | >20% Month 1 Retention |
These benchmarks provide a helpful starting point. If your retention numbers are significantly lower, it might be time to dig deeper into your user experience and identify areas for improvement. If they're higher, that's great! But don't get complacent – there's always room to grow. Keep analyzing those cohorts, keep listening to your users, and keep iterating on your product.
Listening Between the Lines: Qualitative Signals You Can't Ignore
Numbers and metrics are great. They tell you what’s happening: what’s working, what’s not, where users are clicking. But they don't always tell you why. To really grasp how to measure product market fit, you need the why, and that’s where qualitative data shines.
I've been in this game a while, and I can tell you, the founders who really succeed? They're the ones listening deeply to their customers. Not just for the "love its!" and "great job!", but for the subtle cues, the stories behind the words.
For example, I was chatting with a founder the other day who shared a pivotal customer interview. This customer, a beta tester early on, wasn't just praising the product. They were describing how it had woven itself into their daily workflow, become something they relied on. That's a huge difference from simply using something, and a strong signal of true product market fit.
Beyond "Yes" or "No": Uncovering True Customer Sentiment
It's tempting to take surface-level feedback at face value. Sure, a customer says they like your product, but what’s the story behind that “like”? Is there genuine excitement in their voice, or are they just being polite? Are they using it as intended, or are they hacking together workarounds? These little details reveal how much your product really resonates.
To uncover these nuggets, you need to ask the right questions and listen to what's not being said. Instead of “Do you like the product?”, which invites a one-word answer, try something like, “How has this changed your workflow?” or "What would you miss most if you couldn't use it?" You can even check out our guide on: How to Collect Customer Feedback for more ideas. These open-ended questions unlock real stories and insights.
From Users to Advocates: Identifying the Turning Point
Another powerful signal? When customers become advocates. They're not just using your product; they're talking about it–to colleagues, friends, on social media. This organic word-of-mouth is gold. It means your product is solving a real problem, becoming something people are genuinely excited about. It's also crucial to analyze retention rates; you can delve into effective customer retention strategies for more on this.
Pay close attention to how they talk about your product. Are they echoing your marketing language, or are they describing the value in a fresh, compelling way? That can be invaluable for refining your messaging and broadening your reach. By capturing and analyzing these qualitative signals, you gain a much deeper, richer understanding of how your product lives in the real world – the key to sustainable growth.
When the Numbers Don't Add Up: Troubleshooting Your Approach

Sometimes, the data you gather on product-market fit tells a confusing story. You might have stellar survey results, but your retention rate is in the basement. Or maybe retention is solid, but growth has stalled. These inconsistencies aren't always bad news. They often hold valuable insights about your product and its target market.
Decoding Contradictory Data: Spotting the Real Issues
One common problem is a gap between survey responses and what users actually do. Let's say you're building a project management app. Surveys show users love the collaborative features. But your time-on-site metrics? They tell a different story – users barely touch them. This disconnect points to a problem. Perhaps the features are clunky, buried in a confusing interface, or the explanations are lacking. The survey captured user desire, but the product isn't delivering a smooth collaborative experience.
Another issue is focusing on vanity metrics while overlooking more meaningful data. High download numbers are great for bragging rights, but what do they really tell you? If those downloads aren’t converting to active users and lasting engagement, your product might not be solving a real problem. Maybe your marketing is attracting the wrong crowd, or the onboarding experience isn’t compelling. Consider checking out this article on Validating a Business Idea.
Sample Size Matters: Ensuring Reliable Results
Small sample sizes can also skew your findings. Surveying a few users won't give you a true picture of your target market. Aim for a larger, more diverse sample that reflects your ideal customer. This makes your findings statistically significant and applicable to a broader audience. If you're targeting small business owners, make sure your survey includes a range of business sizes, industries, and demographics.
Similarly, biased questions can lead to inaccurate data. Leading questions or limited response options steer respondents towards specific answers. Instead, opt for neutral, open-ended questions that allow for more nuanced responses. For example, instead of asking “Do you find our product easy to use?”, ask “What are your thoughts on the usability of our product?” This approach reveals specific pain points and improvement areas.
Diagnosing the Disconnect: Turning Data Into Action
When your metrics don’t align, it’s time to do some detective work. Look for the root causes of the discrepancies. Are you tracking the right metrics? Are your survey questions biased? Is your sample size too small? Addressing these issues helps you understand your product-market fit and make data-driven decisions that fuel real growth. This analytical process isn't about assigning blame; it's about using data to refine your approach, improve your product, and build something your customers genuinely value.
Building Your Product Market Fit Dashboard
Building a product-market fit dashboard isn't about creating some pixel-perfect work of art. Honestly, it's more about building a consistent rhythm of checking in with your metrics, weaving them into the fabric of how you work. The most successful founders I know don't just sit back and watch the data roll in. They actively use it to create feedback loops, leading to smarter and faster decisions. Let's dive into how to build tracking systems that actually get used, pick the right tools, and create review processes that keep you close to your customers.
Choosing the Right Tools: Balancing Automation and Insight
The right tools for measuring product market fit depend a lot on your current stage and budget. Early on, a simple spreadsheet and a few survey tools like SurveyMonkey or Typeform might be all you need. As you grow, you might explore more robust platforms like Mixpanel or Amplitude for more advanced analytics. One thing I've learned the hard way: Don’t get seduced by all the fancy features. The tool is just that – a tool. It's how you use it that counts.
I know one founder who swore by a simple Google Form for early customer feedback. It wasn't glamorous, but it gave him a direct line to what people were actually thinking. Another founder I worked with used a mix of automated email surveys and personal follow-up calls. The magic is in finding the balance that works for you – automated tracking for the big picture, and manual insights for understanding the “why” behind the numbers.
Setting Up Tracking Systems That Actually Get Used
Building a dashboard that gathers dust is a complete waste of time. I once spent weeks setting up this incredibly elaborate system, only to realize no one on the team even looked at it! The real trick is to keep it simple and laser-focused on the metrics that actually move the needle.
For example, if you're concentrating on retention, set up automated weekly reports that show how your cohorts are performing. If customer feedback is your gold mine, create a system for tagging and categorizing your interview notes. Remember, this isn’t about building a data museum, it's about creating a living document that informs your decisions. You improve what you measure.
Establishing a Rhythm of Review: Staying Connected to Your Customers
Even the best dashboard in the world is useless if you don't look at it. Establish a regular rhythm for reviewing your metrics. Maybe weekly check-ins for your key performance indicators (KPIs), monthly deep dives into customer feedback, and then quarterly reviews to assess overall progress. This creates a consistent habit of connecting with your market.
Think of it like regularly checking in with a friend. You wouldn't go months without talking and expect to know what’s happening in their life. It's the same with your customers. Regular reviews keep you in tune with their evolving needs and desires, making sure your product stays relevant. This is the bedrock of long-term growth and sustainable success.
Key Takeaways
So, you’ve explored the Sean Ellis test, dug into cohort analysis, and seen firsthand how valuable qualitative feedback can be. But how do you actually apply all this to gauge product-market fit? It’s like having all the ingredients for a cake (your metrics) but needing the recipe (your measurement strategy).
Tailoring Your Approach: Stage, Resources, and Product Type
Your strategy should be tailored to your unique circumstances. An early-stage startup with limited resources might focus on the Sean Ellis test and a handful of customer interviews. A larger, established SaaS company might invest in robust cohort analysis using tools like Mixpanel and in-depth customer surveys. Even the type of product matters. A mobile game tracks daily active users, while a B2B SaaS platform prioritizes monthly recurring revenue. There’s no one-size-fits-all solution.
For example, when I launched my first micro-SaaS, I bootstrapped everything. Forget fancy analytics – I relied on direct customer conversations and a simple spreadsheet to track a few key metrics. It wasn’t glamorous, but it gave me the insights I needed to iterate and improve. As the business grew, I incorporated tools like Amplitude to segment users and analyze behavior in more detail. It's all about using the right tools at the right time.
Practical Tools and Templates: Getting Started This Week
This isn’t just theoretical. Here are a few practical tools you can use today:
- Customer Survey Template: Don’t start from scratch. Use a proven template for your Sean Ellis test and other customer surveys. Adapt it to your product and target audience.
- Qualitative Feedback Framework: Organize your customer interview notes and feedback into a structured format. Look for recurring themes and patterns. What are the underlying needs and motivations of your users?
- Tracking System Checklist: Configure your analytics dashboard to track the metrics that actually matter to your business. Don't get lost in vanity metrics. What truly drives growth and retention?
These tools will get you organized and help you gather meaningful data quickly. It's about taking action, not just passively absorbing information.
Iterating and Adapting: The Key to Long-Term Success
Finding product-market fit isn't a one-time event. It’s an ongoing process. As you learn more about your customers and the market, you'll need to adapt your approach. Your initial survey questions might not uncover the insights you need, or your chosen metrics might not reflect the real value your product offers. That's perfectly normal! Iterate, adapt, and refine your strategy as you go. Flexibility and continuous learning are key.
Ready to launch your own AI-powered micro SaaS? AnotherWrapper gives you the tools and templates to build and launch quickly, so you can focus on finding product-market fit faster. Check it out: AnotherWrapper - Build and Launch Your Micro SaaS
Stay ahead of the curve
Weekly insights on AI tools, comparisons, and developer strategies.

Fekri
Building tools for the next generation of AI-powered startups. Sharing what I learn along the way.
Related
Tags
Continue reading
You might also enjoy

Customer Acquisition Cost Calculator: Free Tool to Optimize CAC
Use our customer acquisition cost calculator to accurately measure and reduce your CAC. Boost your marketing ROI with this free, easy-to-use tool!

Validating a Business Idea: Your Complete Success Roadmap
Master validating a business idea with proven strategies that prevent failure. Learn from successful founders who tested their concepts first.

Agile Release Management: Your Complete Guide to Success
Master agile release management with proven strategies that work. Learn from successful teams who've transformed their software delivery process.